Data for the rest of us
It's easy to looks at a chart and assume it's telling you something useful. It's even easier to assume that the more data you cram into a series of graphs, the more it can offer you. This is just not the case. Data is only as useful as it is readable.
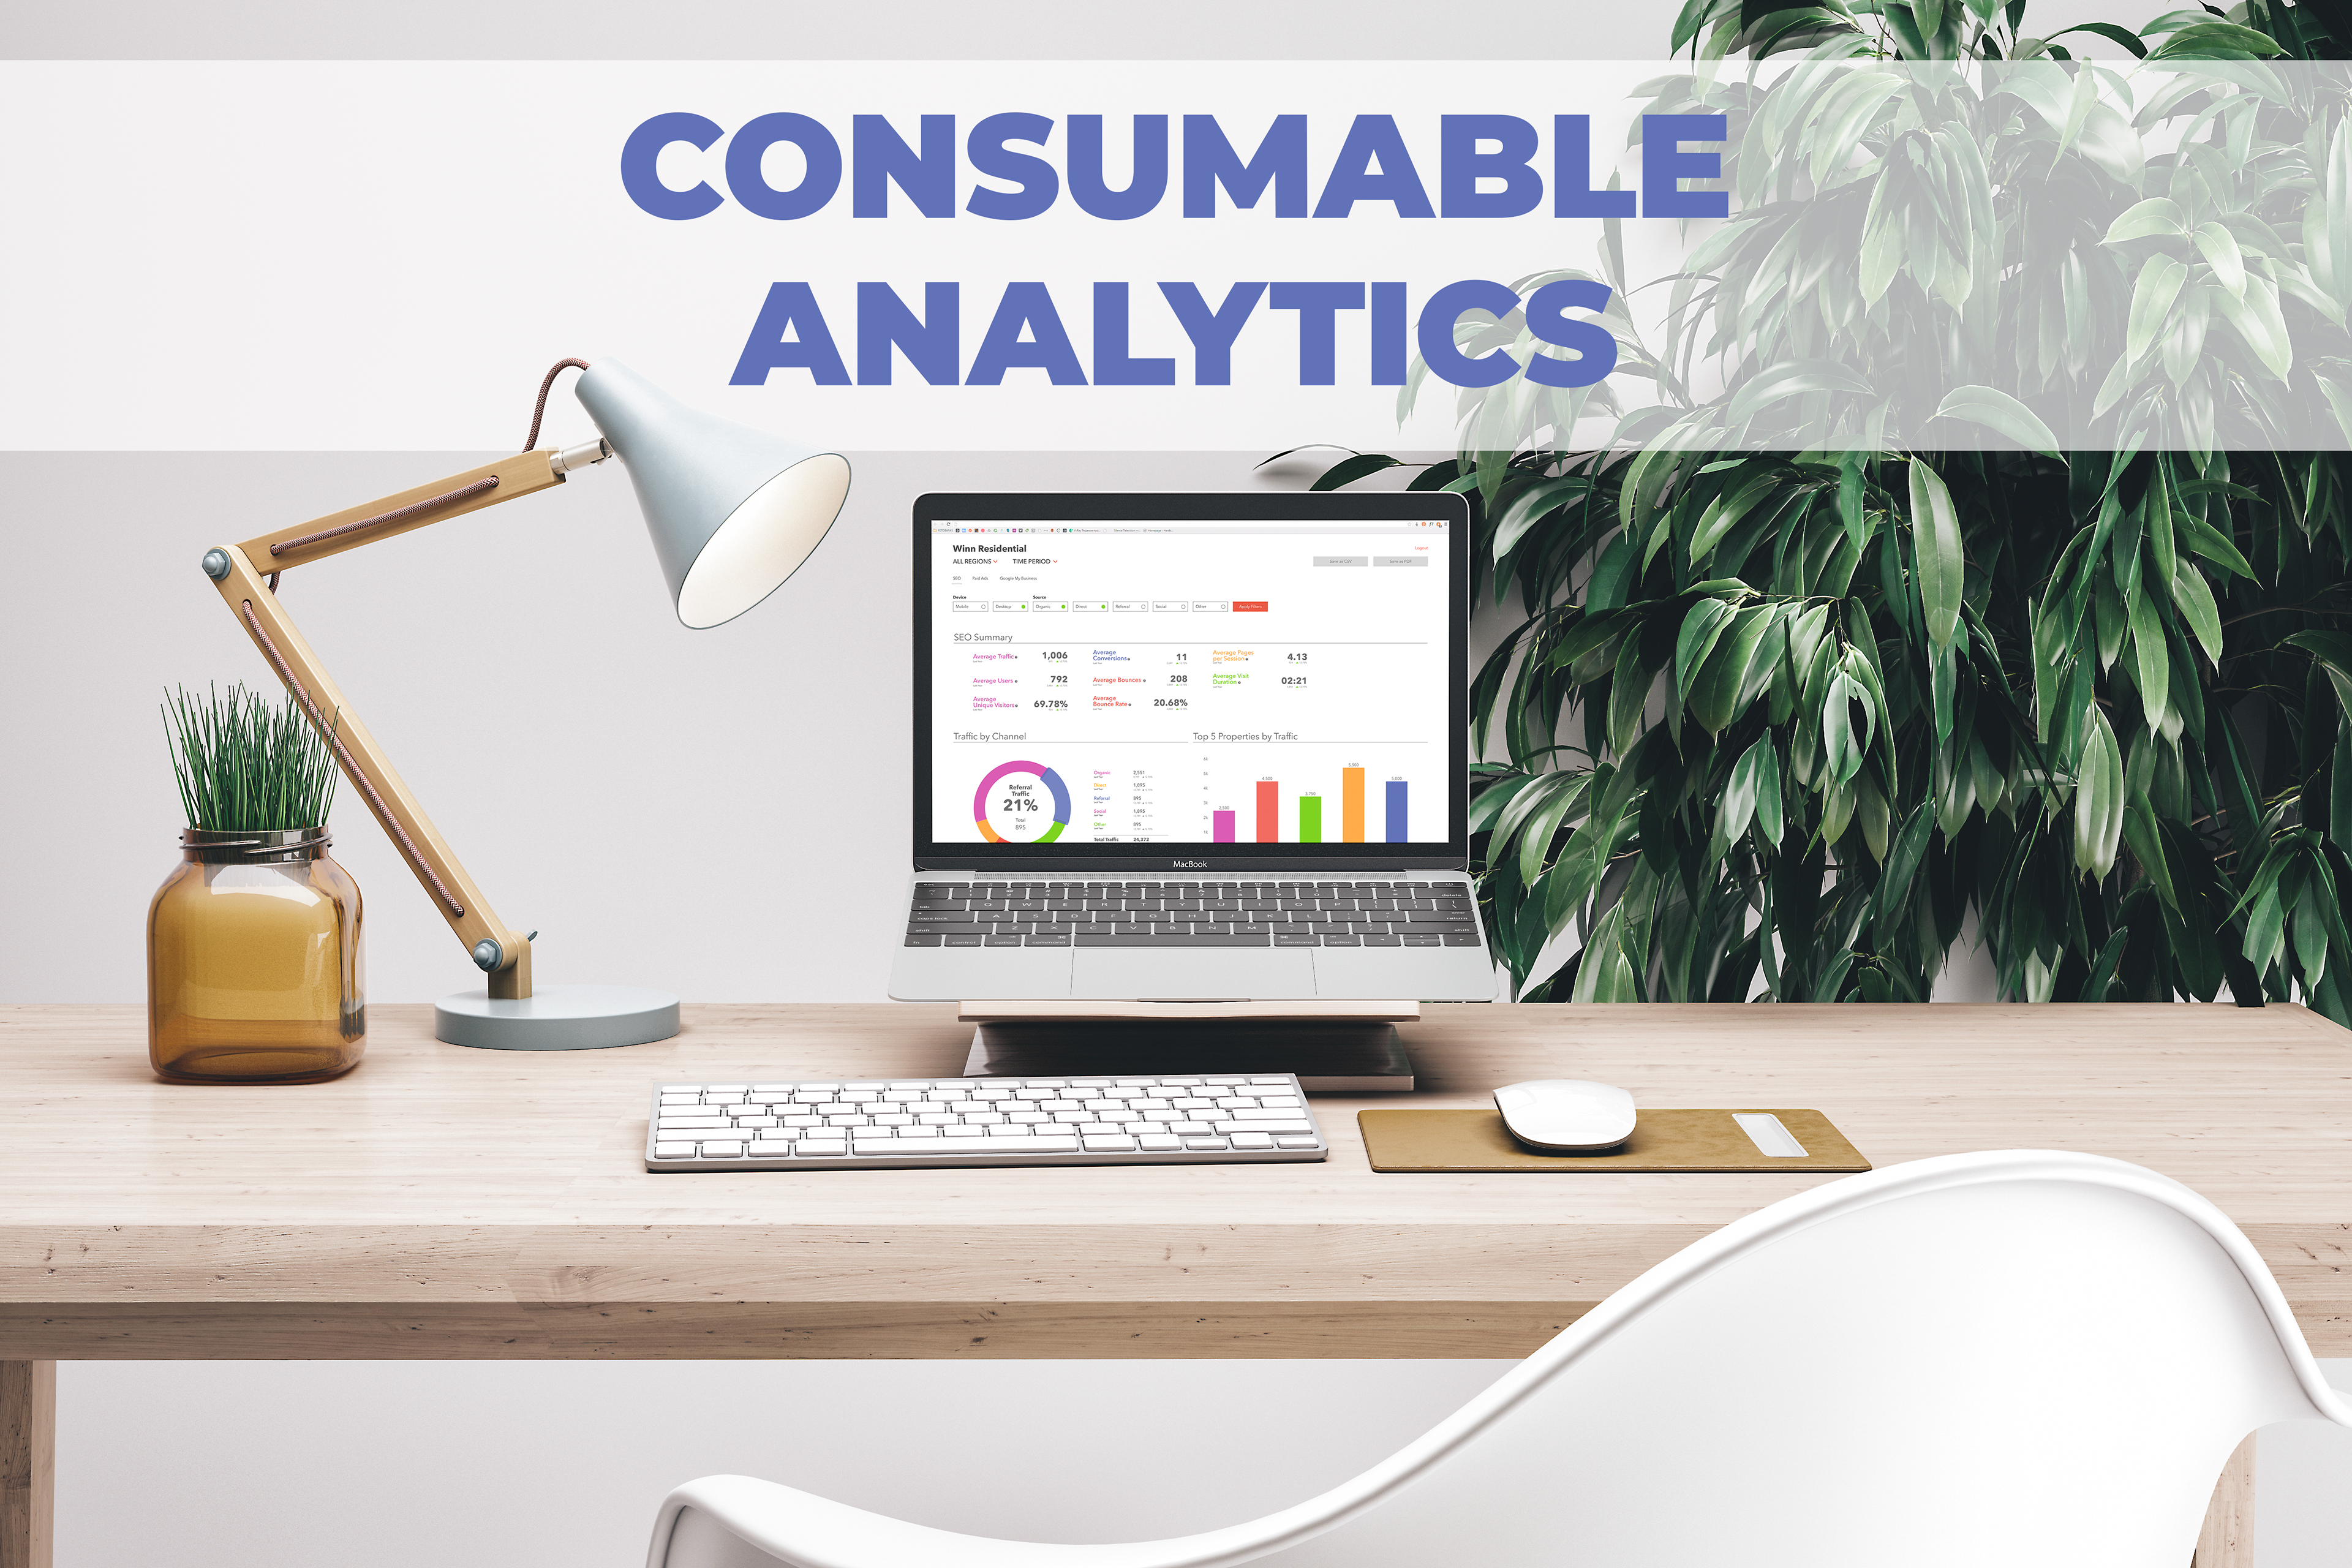
Our company has a wealth of information from the years of data being poured into it. This information could be a fountain of knowledge if wielded correctly. Here's where the problem arises: How can this information be easily consumed to make educated business decisions? A balance between education and understanding of data had to be met. Through working closely with some of our top performing clients, we have been able to develop a library of useful tools that present the data in such a way that, with minimal explanation, can tell a story of what is happening in the moment, and what they can do to influence the future.
A simple approach to a complex situation
It's incredibly easy to become overwhelmed with the possibilities this data presents. We needed a way to distill the most important information to it's most basic form while still having the ability to dive deeper if desired. This gave us the scalability needed to reach both the casual user all the way up to the data analysts that thrive off of this information.
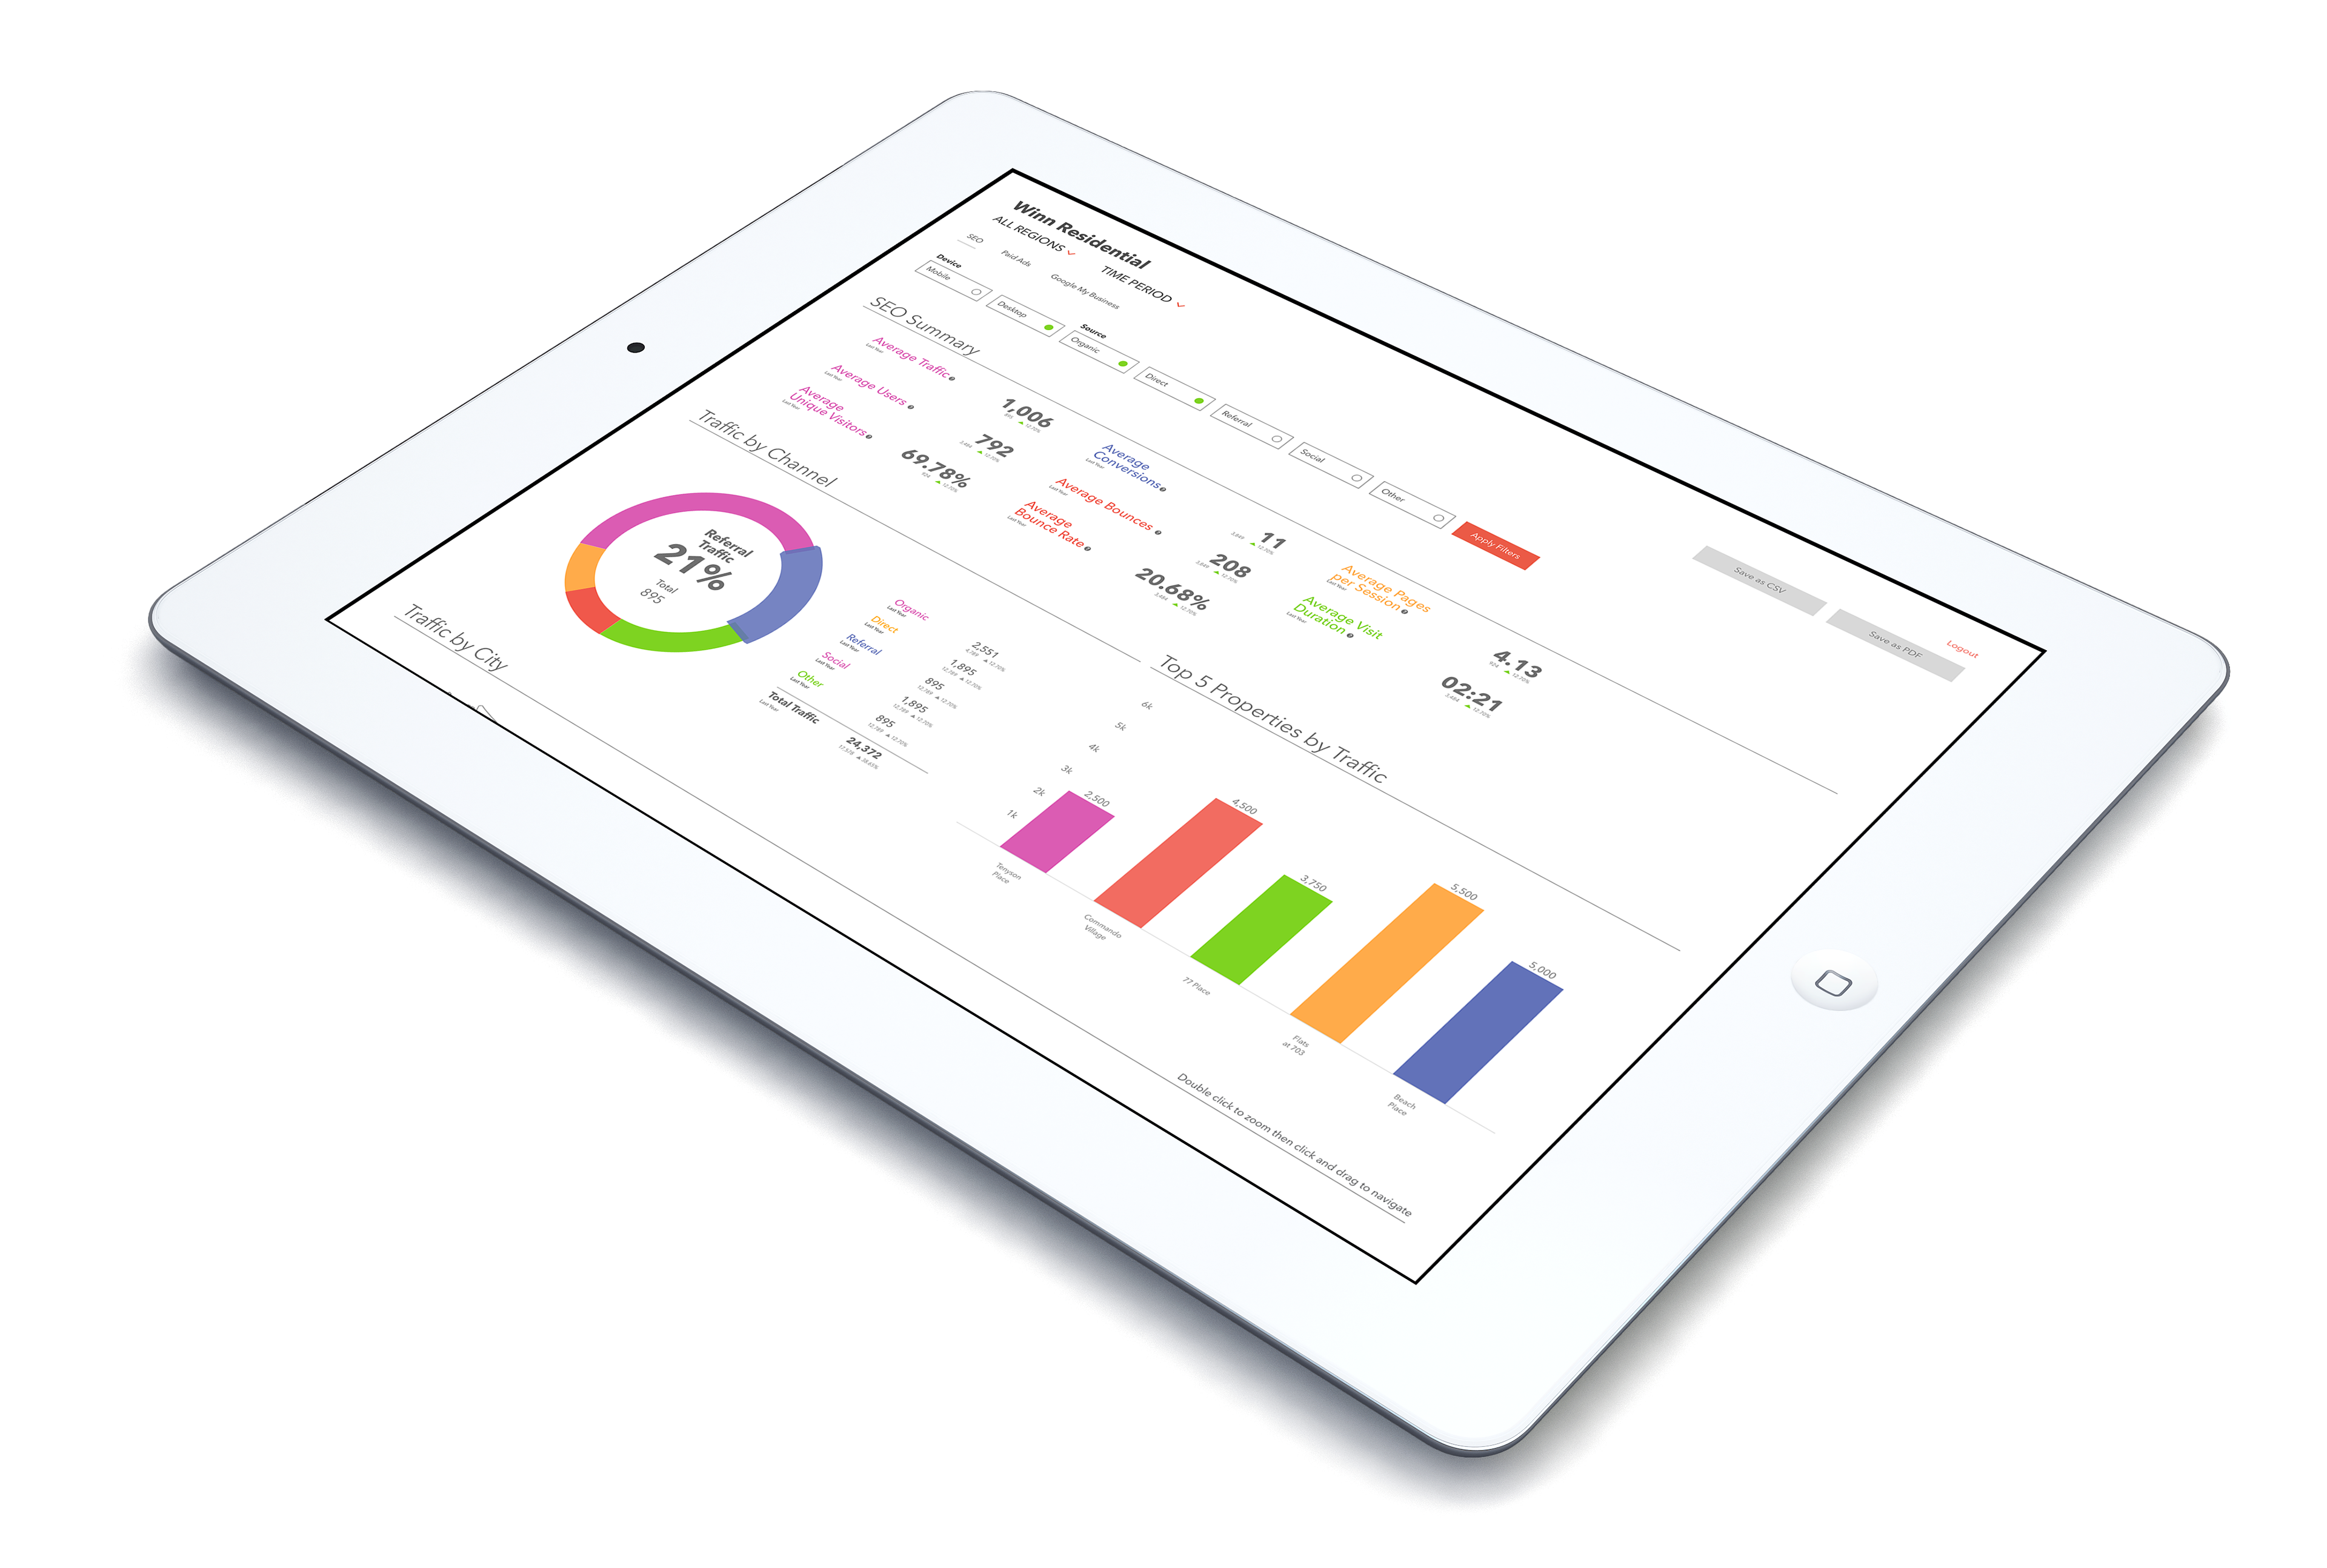
A simple visual approach eased a lot of that overwhelming feeling. A clean, white background supported by minimal color that helped connect data points tells a story in a way that seemed both approachable and obtainable. The labels used to identify specific data points needed to be both concise and descriptive. Sparse tool tips were used for people to help educate themselves and feel more comfortable over time.
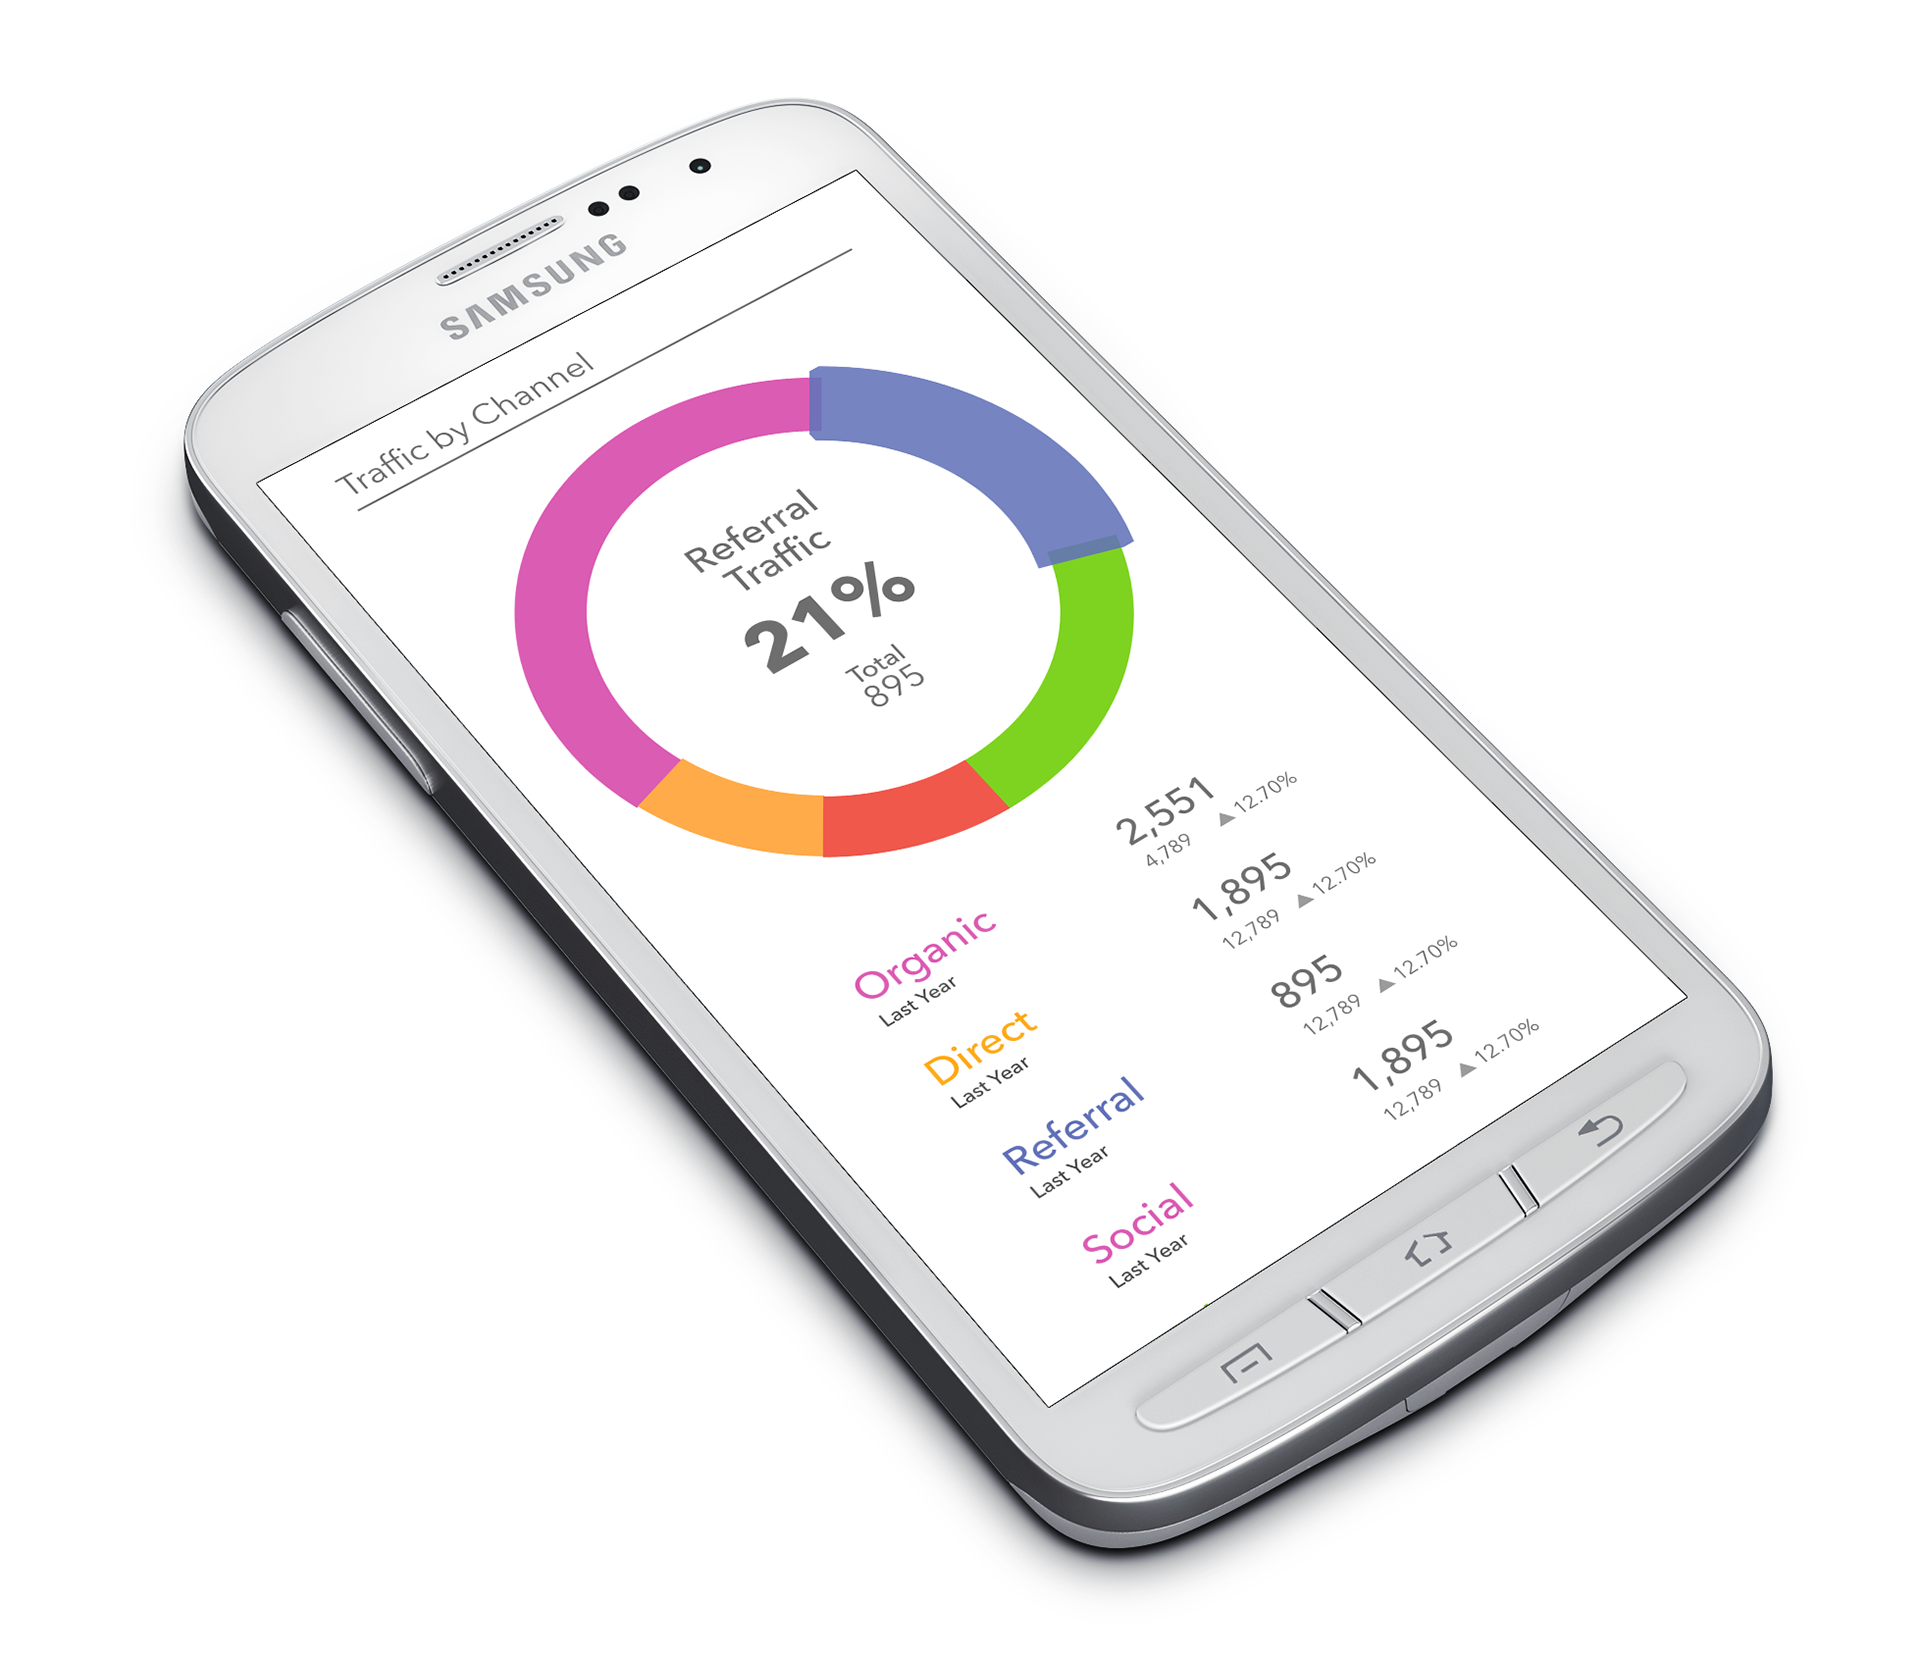
Being able to consume the data on-the-go was crucial for site visits.
Data for decision making
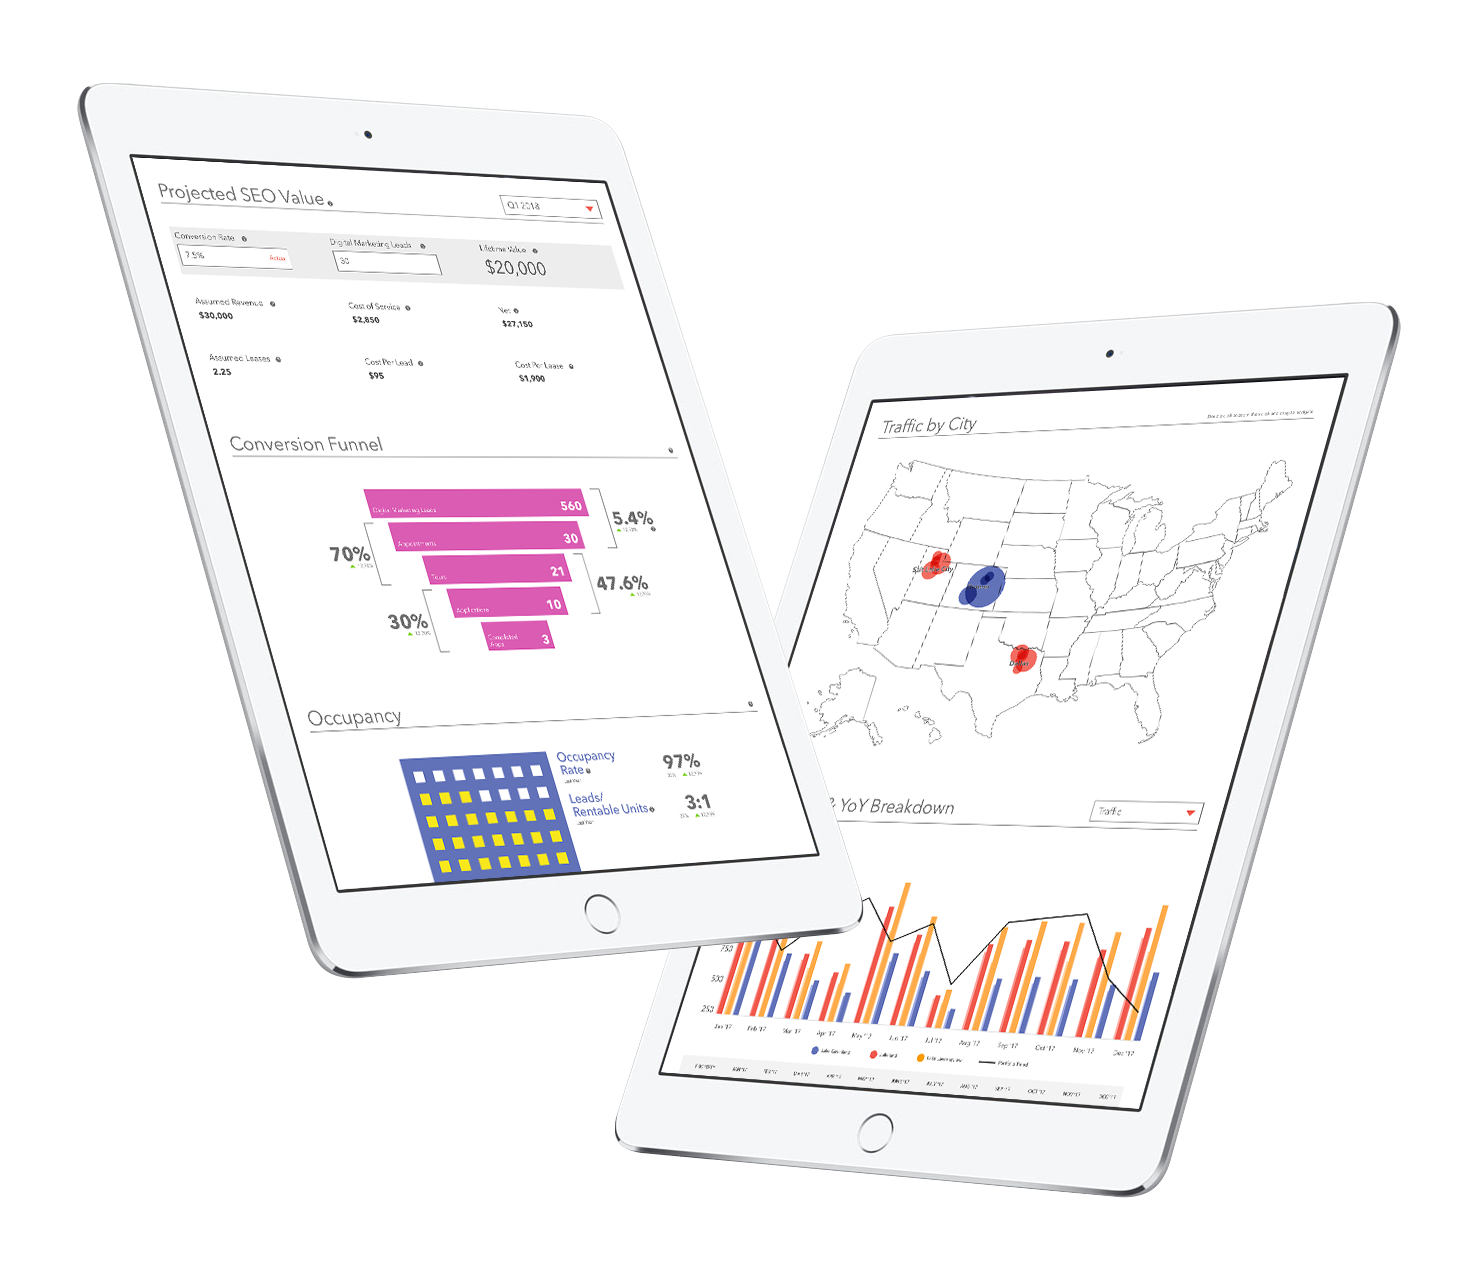
The true power of data comes from how it is applied; how it affects the future. Without this, data is (are?) just some pretty numbers. Through the use of data manipulation and an understanding of previous performance, we are able to present situations that gives actionable steps to create greater revenue for both the client and our company. This is where that sweet spot of product design is found.
Improvise, adapt, overcome
This is all, of course, a fluid process. Through tight collaboration with both clients and product owners we are inundated with constant change. This is a BEAUTIFUL thing. We are able to present ideas and learn what really matters, AND if how we present our ideas makes sense.
Data is always changing. We must be able to adapt to whatever data is available and be able to give it the power it deserves.